Economist's View: New data on incomes and poverty hold good news and bad news
By Gus Faucher
In September, the U.S. Census Bureau released updated data on household income and poverty in the U.S. and Pennsylvania through 2023. As we move further away from the pandemic, the picture is becoming a little clearer.
Even with the highest unemployment rate in decades, households were better off financially in 2020 than in 2019 thanks to federal government aid.
But with high inflation and the end of pandemic stimulus programs, households are now roughly back to where they were in 2019.
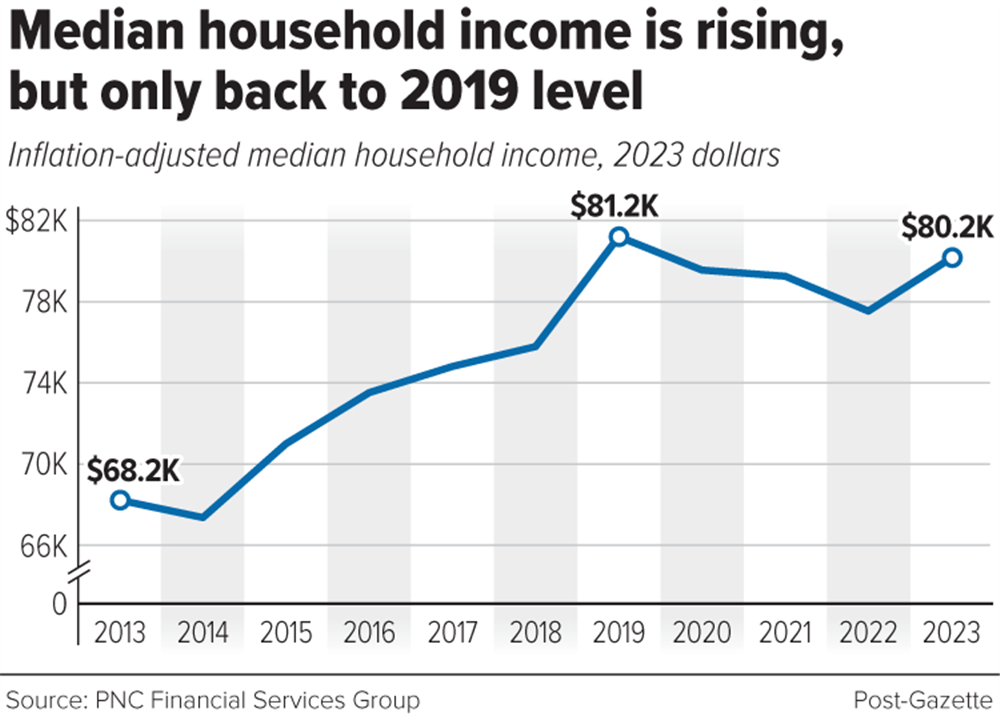
The past few years have been volatile for households and their incomes. According to the Census Bureau, pre-tax median household income rose more than 8% in 2023, to a record high of around $80,600. This followed increases of around 4% in 2021 and 5% in 2022. The median household income fell 1% in 2020 as job losses from the pandemic were a drag.
There are a couple of problems with median household income as a measure of economic health, however.
First, these figures do not consider inflation, which has been a big problem over the past few years. With strong demand in the aftermath of the pandemic, enormous supply-chain disruptions, and higher wages driving up business costs, overall prices in the U.S. economy, as measured by the consumer price index, rose 4% in 2023, almost 8% in 2022 and more than 4% in 2021, the highest three years of inflation in more than four decades.
The good news is that in 2023 income rose at about double the pace of prices, and so the inflation-adjusted median income jumped around 4%, the strongest year of growth since 2019. Still, median household income last year, adjusted for inflation, was slightly lower than before the pandemic in 2019 (see Chart 1).
Another consideration is that median household income doesn’t account for different household sizes.
A single person with an income of $50,000 has a very different lifestyle than a family of four with an income of $50,000. The Census Bureau’s equivalence-adjusted income measure takes into account household size. Census also uses this number to look at the income distribution in the U.S.; not just the median, but also lower- and higher-income households.
Using this measure, households throughout the income distribution saw their after-inflation incomes rise in 2023 from 2022, even with high inflation. And the strongest growth was for the bottom one-third of the income distribution; that is, income gains were strongest for the lowest and lower-middle income households.
The very tight labor market of the past few years has led to above-average wage for lower-income workers, such as those with less experience and less formal education. That being said, for most households, equivalence-adjusted income, after adjusting for inflation, is only back to its pre-pandemic level.
The pandemic, federal government response, and high inflation also have made it difficult to interpret data on poverty. Based on the federal government’s official number, the poverty rate fell to 11.1% in 2023 from 11.5% in 2022 and 11.6% in 2021.
Strong job and income gains over the past few years, especially for lower-income workers, have pushed the poverty rate lower. But like median household income, this poverty number does not include benefits paid through the tax system, in particular the stimulus payments and expanded child tax credit in 2020 and 2021. In addition, the poverty threshold is tied to the cost of feeding a household of three in the 1960s, adjusted for inflation; this measure has become less relevant over time.
The census produces an alternative, the Supplementary Poverty Measure (SPM), that includes tax benefits as well as in-kind assistance such as food stamps (now known as Supplemental Nutrition Assistance Program, or SNAP). The SPM also considers current spending patterns, including local housing costs.
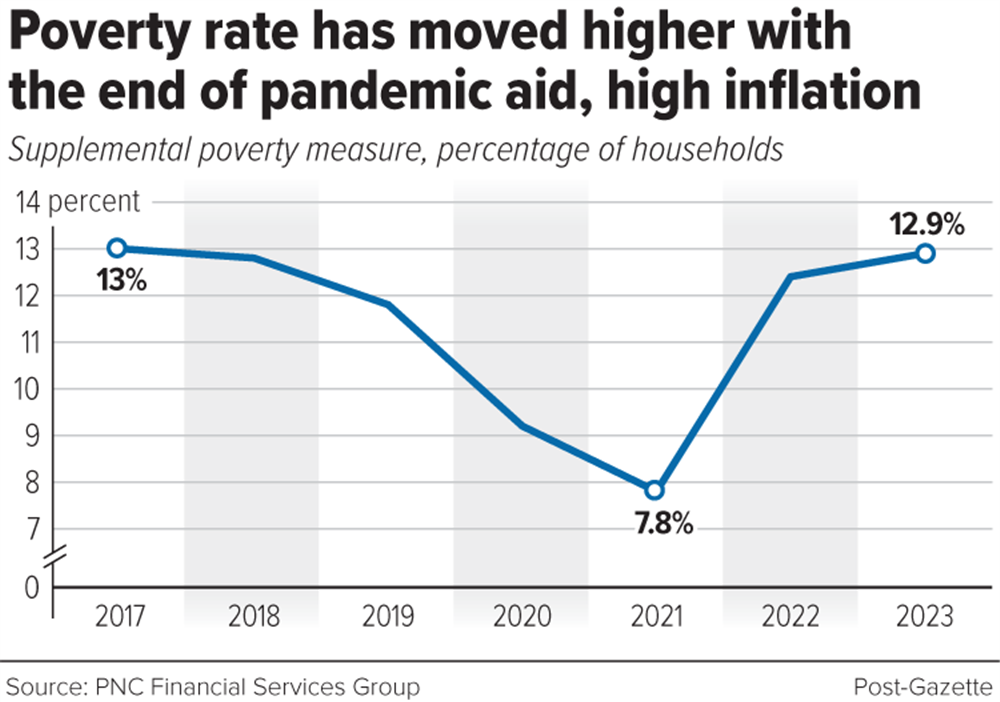
As measured by the SPM the poverty rate fell from 11.8% in 2019 to 9.2% in 2020 and further to 7.8% in 2021, thanks to pandemic-related federal aid. But the SPM jumped to 12.4% in 2022 as this assistance expired, and increased further to 12.9% in 2023 as higher housing costs hit lower-income households (see Chart 2).
It's more difficult to determine what has happened to income and poverty in the Pittsburgh area in recent years. But it is fair to say that household incomes in the Pittsburgh area are, on average, growing more slowly compared to the rest of the country.
This is in large part because of the area’s demographics, with below-average job growth and an older workforce that tends to receive smaller wage increases.
However, the poverty rate in Pennsylvania has remained below the national figure. Averaged over 2021 to 2023, the poverty rate in Pennsylvania was 10.6%, compared to 11.4% nationally. And the Supplemental Poverty Measure rate was 9.1% in Pennsylvania over the same three years, compared to 11% nationally.
Pennsylvania’s high-paying industries, low cost of housing relative to the rest of the country, and older population with stable jobs contribute to below-average poverty in the state.
Gus Faucher is senior vice president and chief economist of The PNC Financial Services Group. He shares his insights on the regional economy each month.